
Suggested Learning Intentions
- To use different tools to represent information, to solve a problem or support an opinion
- To understand the concepts of ‘and’ and ‘or’ when used in the context of probability
Sample Success Criteria
- I can construct a two-way table and a Venn diagram to represent information
- I can use these graphical displays to help solve problems
- I can use a range of manipulatives to model and justify my solutions
- I can explain the meaning of 'and' and 'or' as used in probability
The intention of this task is to introduce the concept of Venn diagrams to arrange elements of a population into sets with a common feature.
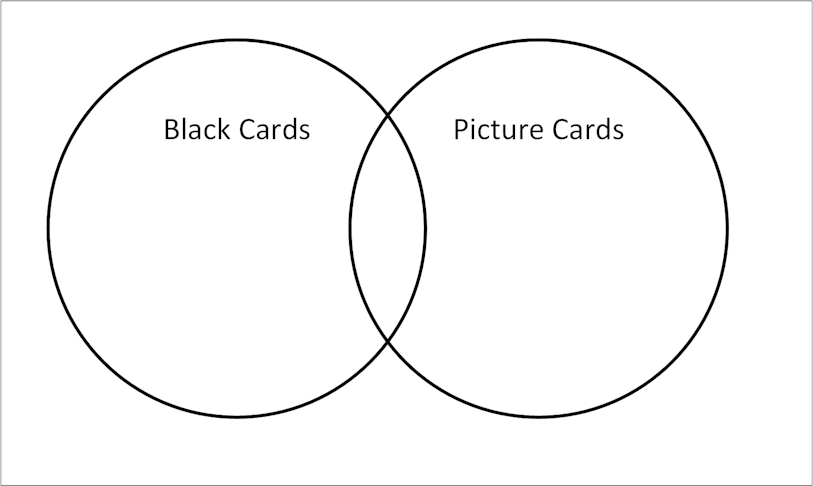
Construct a large Venn diagram on your classroom floor, lengths of wool or string for the circles.
Give each student a playing card, selected randomly from the deck of cards.
Select two descriptions for each of the circles of the Venn diagram. Samples may be ‘black cards’ and ‘picture cards’, or ‘red cards’ and ‘cards with a value less than 8’. Write your descriptions on the board.
Ask students to stand in the best place for them in the Venn diagram, and to justify their choice of position. You could check for understanding by inviting students to suggest where other cards may appear in the Venn diagram.
Summarise the results on the board for the students to see. You can start by writing the individual students names into the relevant parts of the diagram, and then replace these names with numbers, to represent the total number of people who stood in each part of the diagram.
The choice of making this a physical task is deliberate. Amongst other benefits, it involves all students in the room, allows all students to make a personal connection to the activity, and presents students with an image they can refer back to in future.
Collect the cards off the students, shuffle the deck, and repeat this activity as often as required.
The intention of this, and future tasks in the sequence, is to explore a range of mathematical concepts through the context of the Olympic Games. Prior to commencing, you may like to provide opportunities for students to share what they know about the Games, via a brief discussion or a quiz. Students could be asked to discuss their favourite events or athletes. Encouraging a personal connection to the theme can help motivate students to engage with the tasks, as they understand the genuine context in which they are set.
Present your students with a variety of texts to evoke discovery and discussion about Australia’s performance in swimming events at the Olympic Games. A collection of sample texts you may like to use is included in the references section.
Explain that the focus of this activity is to examine Australia’s strong performance in swimming over the years at the Olympic Games more closely.
Present students with this statement:
While Australian swimmers have a history of performing well at the Olympics, we have been more successful in freestyle events than in other events.
Invite students to share their immediate response to this statement. Do they agree? Disagree? Are they unsure? How confident are they at this stage? How could they investigate this statement to formulate a considered response?
Ask students to nominate and research the Australian swimmers they have heard of, as a means of making an informal judgement about whether this statement is true or not. If students have heard of more freestyle swimmers, then it may mean that Australia have been more successful in freestyle events.
Spend some time discussing the different swimming strokes at the Olympics: freestyle, breaststroke, backstroke and butterfly, and events like the individual medley and medley relays. For the purposes of this activity, any event other than freestyle (individual or relay) will be grouped together as ‘other events’.
1. Model the preparation of graphical tools that help us present and analyse data
Present students with the Data Set (see the Materials and texts section above) and explain what it represents. Explain that we can use this secondary data to help formulate a response to the statement.
Note: The last two columns in the Data Set are not required for students to be able to complete either of the graphical displays. You may like to delete these columns before presenting the data to students, as this will help students develop their reasoning skills (e.g. in 1984, if there are 29 swimming events, and 11 of them are freestyle, then we can conclude that there are 18 ‘other events’).
Select one of the Olympic years to explore with the class. Draw a blank Venn diagram (with overlapping sets) on the board and ask students how the information could be represented in a Venn diagram. Students may make different suggestions for the sets to use in the Venn diagram.

Encourage a range of contributions and ‘test’ these on the board. For example, students may suggest that one set be labelled ‘Freestyle Events’ and another set be labelled ‘Other Events’. By testing this, students will see that there will be no overlap between the two sets, and thus these are not helpful sets to use.
As students are exploring different options, remind students of the statement being investigated and emphasise that the sets selected should allow us to formulate a response to the statement.
“We want to know more about whether Australia has been more successful in freestyle events compared with other events, so the sets we choose should help us work out whether this is the case or not”.
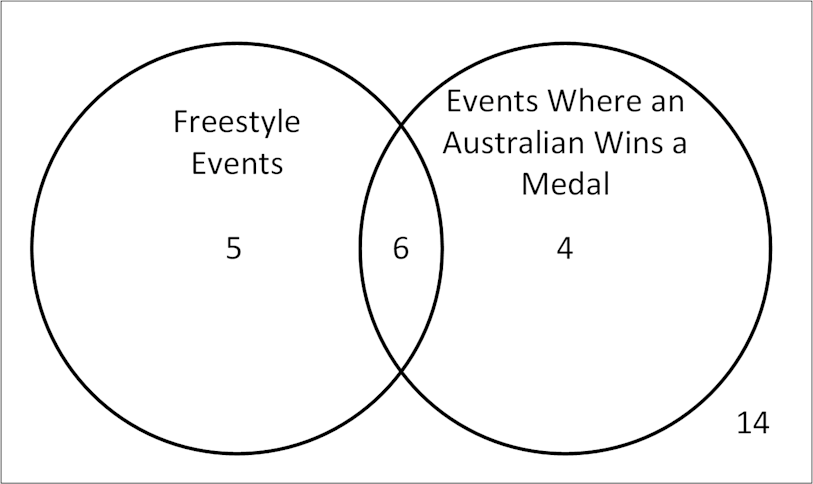
Guide students to use the sets ‘Freestyle events’ and ‘Events where an Australian wins a medal’.
Model the completion of the Venn diagram. For example, for the 1972 data, the diagram would be presented like this:
Provide students with a series of questions to help them develop an understanding of the words “and”, “or” and “not”. Sample questions include:
- What does the 6 in the diagram represent?
- How many events are either freestyle events or an event where an Australian wins a medal?
- Is it more likely that an event is a freestyle event or not a freestyle event?
These questions provide the opportunity to revisit some common language of probability, including, among others, ‘likely’, ‘not likely’, ‘uncertain’, ‘certain’, ‘possible’ and ‘impossible’.
Alternatively, students could be asked to write their own questions, or develop their own statements, about the information presented in the diagram.
| Freestyle event | Other event | Total | |
| An Australian wins a medal | 6 | 4 | 10 |
| An Australian does not win a medal | 5 | 14 | 19 |
| Total | 11 | 18 | 29 |
Introduce the use of two-way tables to represent this information. You could model this explicitly for students, or write a complete table on the board next to the Venn diagram and ask students to notice the similarities and differences.
Facilitate a class discussion with students to highlight the similarities between the two-way table and the Venn diagram. Show how both tools represent the same set of information.
Enable students requiring further support by providing them with a completed two-way table and asking students to transfer this information to a Venn diagram, or vice versa. Alternatively, you could provide them with an incomplete two-way table and Venn diagram that represent the same set of information and ask them to use this information to complete both diagrams. A sample task is included below.
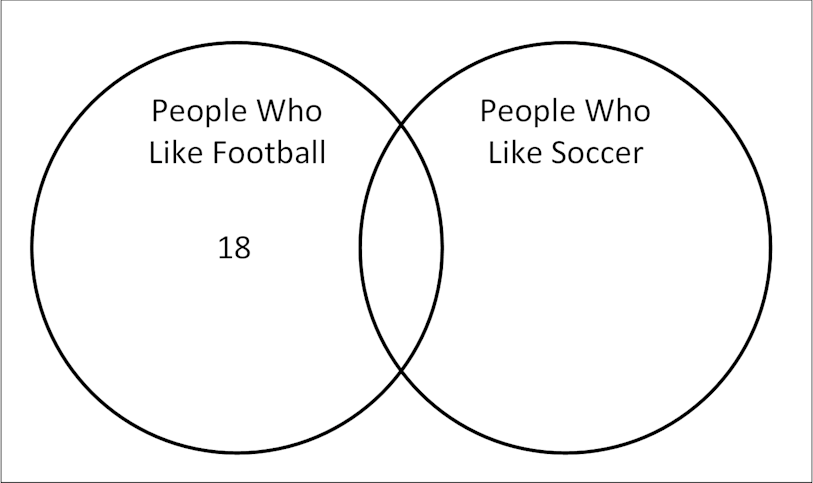
| Like football | Do not like football | Total | |
| Like soccer | 7 | 19 | |
| Do not like soccer | |||
| Total | 40 |

2. Complete a two-way table and Venn diagram, for a randomly selected Olympic Games
Ask students to randomly select one Olympic Games from the Data Set that was held after 1956 and complete their own two way table and Venn diagram for this data. Remind students of various strategies that can be used to ensure randomness.
Provide further opportunities for students to engage further with their diagrams through a series of questions. The questions should continue to develop student use of the words “and”, “or” and “not”. Sample questions include:
- What does 18 represent in the two-way table? Why is 18 not shown in the Venn diagram?
- What’s the chance that an event is freestyle and features an Australian winning a medal?
- Is it more likely that an Australian does or does not win a medal in a selected event?
Encourage students to express their responses to probability questions using fractions, decimals, and percentages.
Emphasise and model particular phrasing that promotes student understanding of probability. For example, you may say ‘the probability of an Australian winning a medal in a race is 10 out of 29’, rather than saying ‘the probability of an Australian winning a medal in a race is ten twenty-ninths’. The use of the phrase ‘out of’ can help students make sense of the fraction ¹⁰/₂₉.

Check for understanding by asking students: ‘If the probability of an American swimmer winning a medal in a race was written as ⁴/₇, what would that mean?’. Students who understand this concept could say ‘Out of every 7 races that are held, we expect that an American swimmer will win a medal in 4 of them’.
As students are completing these questions or statements, ask them to consider the benefits of either tool. Students often comment that they like the two-way table as it shows the totals, which are missing from the Venn diagram.
Provide an opportunity for students to research the information in their displays. For example, for the 1972 two-way table, what does the 4 represent? What were these events? Who were the Australian medallists? Did they represent Australia at any other Olympic Games? What other interesting information can you find out about them?
3. Select a sample of Olympic data and aggregate this data to respond to the statement
Refer students back to the statement presented at the beginning of the activity:
While Australian swimmers have a history of performing well at the Olympics, we have been more successful in freestyle events than in other events.
Discuss with students whether data from one Olympic Games is sufficient to allow us to formulate a considered response to this statement. Guide students to an understanding that a larger sample needs to be taken.
Ask students to sample between six and eight Olympic Games from the Data Set, using a recognised sampling technique.
Suggest to students that they aggregate the data from their sample and produce both a two-way table and Venn diagram to help them respond to the statement.

Collect student displays and responses for assessment purposes.
This stage introduces two key graphical displays used in probability: the two-way table and the Venn diagram. These are key features of the ‘toolbox’ of strategies that students will progressively develop to help them engage and solve problems related to probability. Consider the progress made by students when determining which skills and concepts you select to review.
Two suggested concepts for review are presented below:
1. Complementary events can be described using words such as ‘not’. Their probabilities will always add to one
Emphasise the following concepts:
- The complement of an event can be described as something ‘not happening’. For example, a swimming event can be either freestyle, or not freestyle. It can either rain today, or it will not rain today.
- An event, and its complement, will have their own probabilities. These probabilities will always add to one. For example, if the probability of a Year 8 student being chosen from a population is ³/₁₀, the probability of a Year 8 student not being chosen from a population will be ⁷/₁₀.
- We use specific notation when representing complementary events. An apostrophe can be used to represent a complementary event. For example, if the symbol M is used to represent the event ‘An Australian wins a medal in a swimming event’, the symbol M’ can be used to represent the event ‘An Australian does not win a medal in a swimming event’. Both events M and M’ will have their own probabilities, which will add to one. This can be written as Pr(M) + Pr(M') = 1. You can link this back to the language of probability; particularly the concept of certain events having a probability equal to 1.
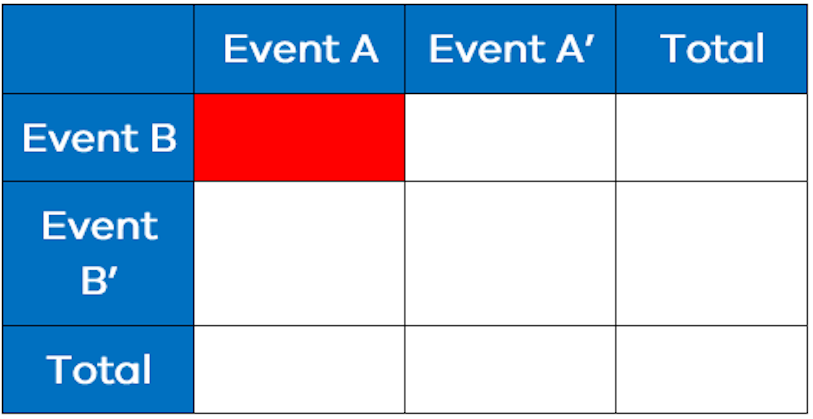
2. Two-way tables and Venn Diagrams can help describe events using language of ‘and’, ‘exclusive or’ and ‘inclusive or’
Emphasise the following concepts:
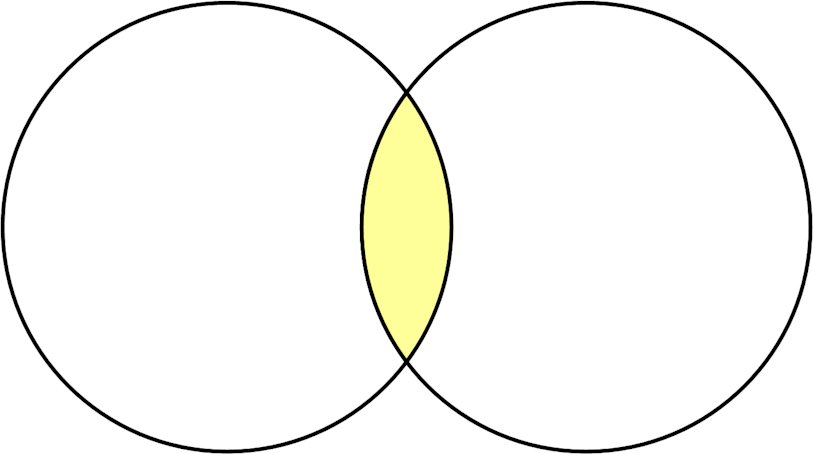
- The word ‘and’ in probability often relates to two events occurring at the same time. For example, a swimming event can be ‘a freestyle event’ AND ‘an event in which an Australian won a medal’.
- Graphically, this concept can be represented by the red shaded area on the two-way table, and the yellow shading on the Venn diagram below.
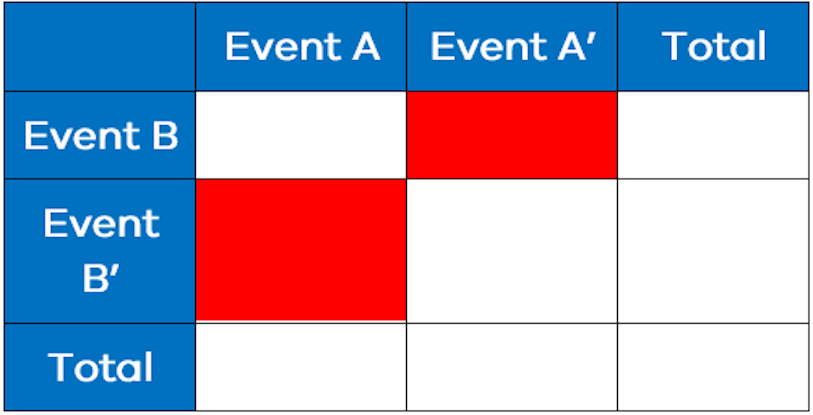
b) Symmetric difference of two sets
- The word ‘or’ in probability can represent the concept known as ‘exclusive or’, where either one event can happen, or a second event, but not both. For example, a swimming event could be either a freestyle event, or an event in which an Australian won a medal, but not both.
- Graphically, this concept can be represented by the red shaded area in the two-way table and the yellow shading on the Venn diagram below.
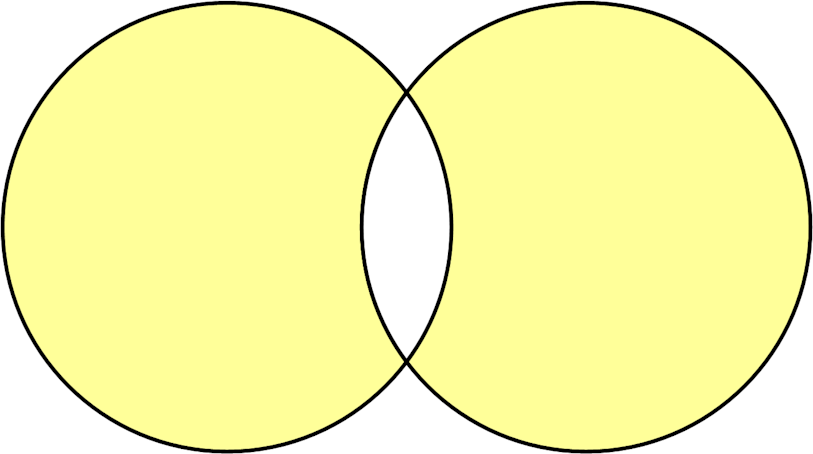
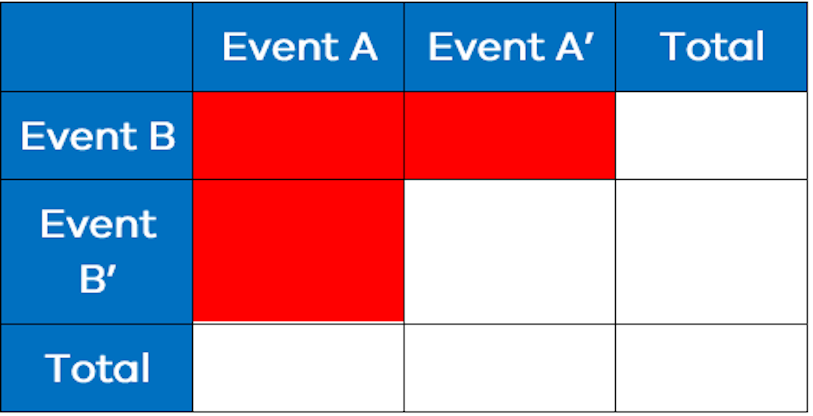
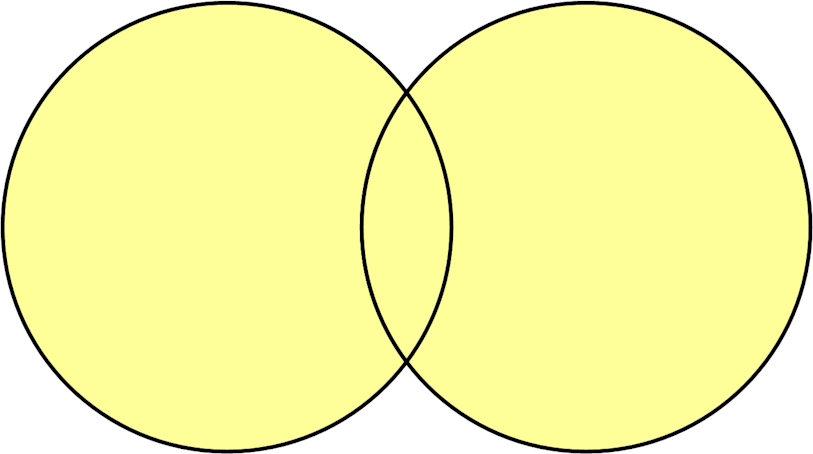
The word ‘or’ can also represent the concept known as ‘inclusive or’, which means either one event occurring, or a second event occurring, or both events occurring. For example, a swimming event could be described as a freestyle event, or an event in which an Australian won a medal, or both.
Graphically, this concept can be represented by the red shaded area in the two-way table, and the yellow shaded area on the Venn diagram below.
Extend students by introducing more formal notation related to probability, including the symbols U for union and n for intersection.
Olympic, 2012. Australia takes on the undefeated USA – Men’s 4 x 100m Relay – Sydney 2000. [Online]
Available at: https://www.youtube.com/watch?v=m2IGm4UC73U
[Accessed 15 March 2022].
Olympic, 2013. Australia’s Olympic Icon – Dawn Fraser – Tokyo 1964 Olympics. [Online]
Available at: https://www.youtube.com/watch?v=JFg4jJudtuU
[Accessed 15 March 2022].
Swimming Australia, n.d. Olympic Games Fast Facts. [Online]
Available at: https://www.swimming.org.au/open-water-2020-vision/australian-swim-team-history/olympic-history/olympic-games-fast-facts
[Accessed 15 March 2022].
Swimming Australia, n.d. Olympics History. [Online]
Available at: https://www.swimming.org.au/olympic-history
[Accessed 15 March 2022].
Wikipedia, 2019. Venn Diagram. [Online]
Available at: https://en.wikipedia.org/wiki/Venn_diagram
[Accessed 15 March 2022].
Other stages
1. An Introduction to Sampling
EXPLORESuggested Learning Intentions
- To understand that sampling is necessary to make inferences about a population
- To be able to explain and use at least two different sampling techniques
Sample Success Criteria
- I can explain how a sample could be used to make inferences about a population
- I can use a recognised sampling technique to select a sample
- I can model and justify my thinking using a range of manipulatives
3. Olympic Attitudes
EXPLORESuggested Learning Intentions
- To understand that different samples taken from the same population can provide different statistical measures, and lead to different inferences being made about the population
- To recognise that bias can influence the sampling process
Sample Success Criteria
- I can explain how the sampling process can be influenced by bias
- I can compare statistics drawn from different samples of the same population
- I can explain why statistics from different samples of the same population could show different information
- I can explain and justify my thinking using a range of manipulatives
4. Does Hosting Help?
EXPLORESuggested Learning Intentions
- To synthesise and analyse data from a variety of sources to make inferences
- To informally identify outliers and explain their impact
Sample Success Criteria
- I can use data that includes outliers to make inferences about a population
- I can identify outliers and explain their impact on a data set
- I can explain my thinking and solutions using a range of manipulatives