
Suggested Learning Intentions
- To understand that sampling is necessary to make inferences about a population
- To be able to explain and use at least two different sampling techniques
Sample Success Criteria
- I can explain how a sample could be used to make inferences about a population
- I can use a recognised sampling technique to select a sample
- I can model and justify my thinking using a range of manipulatives
- Coloured blocks and a bag to draw them from
- Access to online random selectors
Present students with a scenario:
“A high school in Madrid, Spain, have contacted us, as they are interested in setting up a sister school relationship with us. They’ve asked for us to give them an idea of what students in our class are typically like”.
You may like to consider changing the country used to align with the language/s taught in your school.
Select one student at random from the class. You could do this by drawing their names out of a hat, assigning each student a number and using a random number generator, or using an online tool such as Wheel of Names (prepare for use before the class).
“OK, we’ve picked Tahmena. Tahmena has brown hair and wears glasses. We can tell the school in Madrid that students in our class typically have brown hair and wear glasses”.
Discuss whether this approach provides a good representation of the class. Invite students to suggest their own ideas. Introduce the concept of a sample to students, and that in this instance, the population being sampled is our class. Guide students to an understanding that increasing the sample size would be a useful strategy. Trial different sample sizes.
“This time we selected eight students in our sample, and two of them caught the bus to school. We can tell the school in Madrid that in our class, about one quarter of our students typically catch the bus to school”.
Ask students to consider what sample size may be the most appropriate to properly represent our class. Students are likely to suggest that larger sample sizes will give us a better representation, and that everyone in the class could in fact be included in the sample. Validate this approach, and then continue the story:
“Our friends in Madrid have enjoyed learning more about our class, but now they want to know more about Australia, as none of them have been here before. How can we collect some information about the characteristics of students in Australia?
Moving from a population size of a single class to the whole of Australia is a significant leap but has been chosen to emphasise the realities of working with large populations. You may like to change this question so, that instead of all of Australia, the school from Madrid wish to know more about a population such as:
- students from the whole school
- students from our suburb or town
- students from the city of Melbourne
- students from the state of Victoria
Emphasise that collecting information about the whole of our class would be possible due to the very small size of the population but collecting information about much larger populations (such as suburbs, cities, states and nations) is far more time consuming and costly. Students should begin to develop an appreciation of the need for sampling for such large populations.
Invite students to consider and share ways in which we may collect information about the characteristics of different students from a larger population. Students are likely to start with concepts related to simple random sampling, but may intuitively develop and demonstrate an understanding of other sampling techniques, including:
- Stratified sampling. Students may say: “To collect information about students from our school, we should make sure we ask students from different year levels”.
- Cluster sampling. Students may say: “To collect information about students from the state, we could go around to some different towns and ask students from there”.
- Convenience sampling. Students may say: “To collect information about students from our suburb, we could ask people who play in my netball team”.
The purpose of this part of the stage is to illustrate how sampling can help us make inferences about a population. You will need to work with another class to complete this section.
Explain that we are going to make inferences, or predictions, about another class at your school by selecting a range of samples.
Invite a sample of 4 students from another class into your class. Ask your students to make a prediction about a particular characteristic of students in that class, based on the sample. To help with their prediction, students in your class may like to ask questions of the sampled students. For example, if students in your class wanted to make inferences about the proportion of students in the other class who travel to school by public transport, they may ask questions such as ‘how did you get to school today?’
Once your students have collected information from the sampled students, discuss how this information could be used to make an inference.
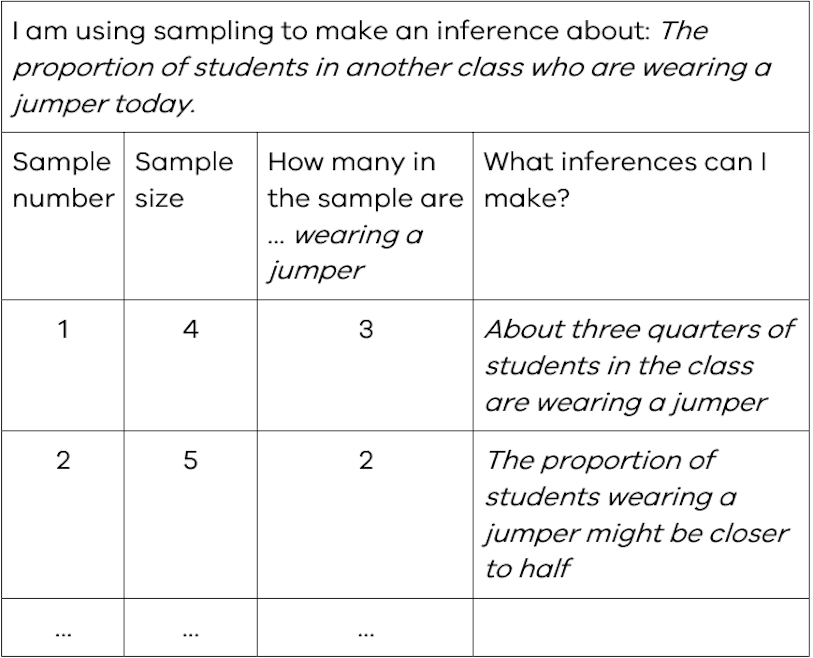
For example, if three students from the sample of four are wearing a jumper, students in your class may infer that the proportion of students in the population (class) who are wearing a jumper is about three quarters.
You may need to revisit the concept of proportion with your students prior to or during this activity. In this context, the word proportion could be replaced with ‘fraction’ or ‘percentage’. Using these terms interchangeably can help increase student awareness and confidence when working with these concepts.
Repeat the sampling process a few times, inviting different sized samples into your class. It is important that the samples are chosen so that some students in the population are selected more than once.
Ask students to use their information gathered from different samples to refine the inferences they have made about the other class.
For example, if the next sample is of five students, and two of them are wearing a jumper, students in your class may like to change their initial inference of ‘about three quarters of the population are wearing a jumper’.

Enable students by providing them with a table to record their samples and organise their thinking. A suggestion for the structure of the table is provided here:
Once students have had an opportunity to finalise their inferences, visit the class so students can observe the entire population and gauge the accuracy of their prediction.
Return to your classroom and discuss the accuracy of the predictions made. Invite students to share the strategies they used to make their predictions.
The process of repeated sampling to make inferences about a population can also be modelled using the next suggested activity. You may like to do this instead of, or in addition to, the activity outlined above.
Place a number of small, coloured blocks into a bag. For example, 12 red blocks, 2 blue blocks, 5 green blocks and 6 yellow blocks.
Ask your students to make an inference about the colours of the blocks in the bag by selecting repeated samples from the bag. Students may like to record the samples and continually refine their prediction.
You may like to tell students how many blocks are in the bag in total, or you may like to leave the size of the population unknown. In this case, students will be making inferences about the proportions of blocks with a certain colour in the bag (e.g., from repeated sampling, students may infer that about one third of the blocks in the bag are yellow).
As you provide repeated samples, ask students how many samples they feel need to be drawn before they can make a confident prediction. Some students may make a prediction based on fewer samples than other students, which will provide useful discussion points later on.
Invite some students to share their predictions with the class, and record these on the board.
Finally, reveal the blocks in the bag, and invite students to compare their sample with the actual population. Discuss the differences between the various predictions made by members of your class.

This activity could be completed in pairs or small groups. Each pair or group would need their own collection of coloured blocks; one student would act as the sampler, and the others act as recorders. This gives you the opportunity to move around the classroom to discuss the task with students and respond to any queries.
This stage exposes students to the concept of sampling in a practical manner. Consider the progress made by students when determining which skills and concepts you select to review.
1. A sample allows us to make inferences about a population
Emphasise the following concepts:
- A sample is a collection of some members of the population.
- We rarely, if ever, know the true characteristics of a population, particularly populations that are quite large.
- Samples are necessary to infer characteristics from a population, as the costs of collecting information from an entire population can be significant, both in terms of time and money. You may like to reference the Census and emphasise that it is only conducted every five years for a reason!
- The results of a sample can be very representative of the actual population, provided that good sampling techniques are used (including repetitive sampling of the same population), and the sample size is considered.
- Sampling does not necessarily lead to correct inferences being drawn about a population. You can reference the outcome of the 2019 Australian Federal Election as an example of where the outcome did not match many of the predictions. Two news articles that discuss this point are included in the References section for your consideration.

2. A variety of techniques can be used to select a sample from a population
Emphasise any of the following concepts. Use the suggestions made by students in the Get started part of this stage to inform which sampling techniques you formally review with your class. It is suggested that you have a focus on simple random sampling and at least one other sampling technique.
- A simple random sample is one where every member of the population has an equal chance of being selected. For small populations, this can be achieved by ‘drawing names out of a hat’ or using an online tool. By assigning each member of the population a number, and using a random number generator, simple random samples can be efficiently selected from large populations.
- Stratified sampling involves dividing the population up into groups that share a common attribute, and then sampling from each group in a way that reflects the proportional size of each group. For example, if a stratified sample of twenty students was to be selected from a group of forty Year 7 and sixty Year 8 students, eight students in the sample should be from Year 7 and twelve should be from Year 8.
- Cluster sampling involves dividing the population up into groups, or clusters, and then selecting a sample only from some of those clusters. For example, if a school was selecting a sample of students, they may divide the population up into year levels, and then only select students from Year 7 and Year 12.
- Systematic sampling involves selecting a sample using a systematic or methodical process. For example, the sample may include every 10th member of the population, or every 50th.
- Convenience sampling involves selecting a sample that is easy to access. For example, if a teacher wanted to select a sample of students from her school, she could ask students who are only in her class, as she has regular contact with them.
Extend students by asking them to complete a more detailed investigation into stratified sampling. Students may explore populations that could be divided into a greater number of strata and compare stratified sampling to random sampling to see which technique provides a better representation of the population. A suggested task could involve students selecting a sample of countries and using this sample to infer the average national population of all countries. Students could select a random sample and a stratified sample, using continents as a means of stratifying the population.
Enable students to consolidate their understanding of sampling by providing them with a newspaper article or other publication, or asking them to find their own, where sampling has been used to make an inference about a population. A collection of sample articles you may like to use is included in the references section.

Provide a series of prompts for students to respond to, including:
- Who is the population being referred to in this article?
- What inferences have been made about the characteristics, features, or views of the population?
- How have these inferences been formed?
- What information is provided about the sampling techniques used?
- Which organisations, other than those already mentioned in the article, might be interested in this sample? How could they use this information?
Bennett, E., 2018. Climate of the Nation 2018: Tracking Australia’s attitudes towards climate change and energy, The Australia Institute. [Online]
Available at: https://australiainstitute.org.au/wp-content/uploads/2020/12/180911-Climate-of-the-Nation-2018-PRINT.pdf
[Accessed 22 March 2022].
FT Editor, 2018. 2.75 million A-League supporters in 2018, Football Today, 24 October. [Online]
Available at: https://footballtoday.news/features/2.75-million-a-league-supporters-in-2018
[Accessed 15 March 2022].
Kyodo News, 2019. 60% of para athletes fret public interest may wane after Tokyo Games, Kyodo News, 24 August. [Online]
Available at: https://english.kyodonews.net/paralympics/news/2019/08/a8a55d155e47-60-of-para-athletes-fret-public-interest-may-wane-after-tokyo-games.html
[Accessed 15 March 2022].
Murphy, K., 2019. Essential poll: majority of Australians want Indigenous recognition and voice to parliament, The Guardian, 12 Jul. [Online]
Available at: www.theguardian.com/australia-news/2019/jul/12/essential-poll-majority-of-australians-want-indigenous-recognition-and-voice-to-parliament
[Accessed 15 March 2022].
Scully, R., 2019. ‘How did pollsters get the Australian election result so wrong?, New Scientist, 20 May. [Online]
Available at: www.newscientist.com/article/2203837-how-did-pollsters-get-the-australian-election-result-so-wrong/
[Accessed 15 March 2022].
Truu, M., 2019. Worse than the Trump polling fail: How did the federal election polls get it so wrong?, SBS News, 19 May. [Online]
Available at: www.sbs.com.au/news/worse-than-the-trump-polling-fail-how-did-the-federal-election-polls-get-it-so-wrong
[Accessed 15 March 2022].
Wade, M., 2017. Australia Day: Survey shows a majority aren’t sure what is commemorates, The Sydney Morning Herald, 1 March. [Online]
Available at: https://www.smh.com.au/national/australia-day-survey-shows-a-majority-arent-sure-what-it-commemorates-20170301-gunnu4.html
[Accessed 15 March 2022].
Other stages
2. Podiums and the Pool
EXPLORESuggested Learning Intentions
- To use different tools to represent information, to solve a problem or support an opinion
- To understand the concepts of ‘and’ and ‘or’ when used in the context of probability
Sample Success Criteria
- I can construct a two-way table and a Venn diagram to represent information
- I can use these graphical displays to help solve problems
- I can use a range of manipulatives to model and justify my solutions
- I can explain the meaning of 'and' and 'or' as used in probability
3. Olympic Attitudes
EXPLORESuggested Learning Intentions
- To understand that different samples taken from the same population can provide different statistical measures, and lead to different inferences being made about the population
- To recognise that bias can influence the sampling process
Sample Success Criteria
- I can explain how the sampling process can be influenced by bias
- I can compare statistics drawn from different samples of the same population
- I can explain why statistics from different samples of the same population could show different information
- I can explain and justify my thinking using a range of manipulatives
4. Does Hosting Help?
EXPLORESuggested Learning Intentions
- To synthesise and analyse data from a variety of sources to make inferences
- To informally identify outliers and explain their impact
Sample Success Criteria
- I can use data that includes outliers to make inferences about a population
- I can identify outliers and explain their impact on a data set
- I can explain my thinking and solutions using a range of manipulatives