
Suggested Learning Intentions
- To understand that different samples taken from the same population can provide different statistical measures, and lead to different inferences being made about the population
- To recognise that bias can influence the sampling process
Sample Success Criteria
- I can explain how the sampling process can be influenced by bias
- I can compare statistics drawn from different samples of the same population
- I can explain why statistics from different samples of the same population could show different information
- I can explain and justify my thinking using a range of manipulatives
- Access to the internet will be required for students who wish to create and administer online surveys
- Computer, laptop or tablet access if using digital survey tools
This stage investigates the potential for bias in sampling techniques, using the context of the Olympic Games.
You could modify the investigation to a local context by co-constructing a question or statement that is of importance to your students, and that may provoke varied responses from different community members. Students could discuss various perspectives on this issue, consider ways in which biased and unbiased samples may be collected, collect primary data from the population using various sampling techniques, and then compare and discuss the inferences made from the samples collected.
Pose this question to students:
Are the Olympic Games still relevant and worthwhile to Australians?
Invite some initial discussion about this concept. You may like to present students with a variety of texts to evoke discussion about this question. A collection of sample texts you may like to use is included in the references section.

As part of your discussion, encourage students to not only express their own opinion, but to also consider other perspectives on this question. This can be done by providing a range of questions, such as:
- Who might agree that the Olympics are still relevant? Why might they feel this way?
- Who might argue that the Olympics are no longer relevant and worthwhile? Why might they feel this way?
- How might we investigate the attitudes of Australians towards the Olympics?
Guide students towards an understanding that:
- the actual number, or proportion, of Australians who agree with that statement is unknown
- a sample of the population could be selected to allow us to make inferences about the views of the population.
Explain to students that they are going to collect their own sample of primary data as part of an investigation into the attitudes of Australians towards the Olympics.
1. Discuss the potential role of bias in the sampling process
Facilitate a class discussion about the concept of bias. First, invite students to share their general understanding of bias. Students may talk about taking one side over another, or being unfair, or being prejudiced about an issue or concept.
Next, ask students to consider the effect that a biased sampling process may have on the inferences you make about the views of a population.
Provide students examples of biased sampling processes and discuss how this may lead to misleading conclusions being drawn about a population. Examples include:
1) An animal shelter was investigating public opinion into pet adoption. They sent out a survey to everyone who had adopted a pet from their shelter.
- This is not representative of public opinion as the sample is taken only from people who have adopted pets. The sample may be biased in favour of pet adoption, which may not represent the views of the public in general.
2) A school principal was investigating student opinion about the fairness of school discipline procedures. She asked all students who had been suspended in the past 12 months.
- This is not representative of the student body as she is only asking students who have been suspended. The sample may be biased against the current procedures, which may not represent the views of the student population.
3) A council was investigating public opinion of their community facilities. A councillor set up a survey booth outside a newly built basketball stadium and asked families as they came in on a Saturday morning.
- This sample of people using the basketball facilities may not be representative of the public who use a broader range of council facilities. In addition, because the stadium is new, the sample may be more likely to provide a view that community facilities are of a high standard.
Ask students to consider whether individuals or interest groups may deliberately choose to use a biased sample. Guide students to an understanding that individuals or groups with a vested interest may choose a biased sampling technique that enables them to make inferences about a population that suit their interests.
If your students are familiar with cluster sampling, discuss how this technique could be seen as inherently biased. An example for discussion would be collecting public opinion on Australia’s favourite football code, and sampling only people who live in Victoria and Tasmania. These states are more likely to produce results in favour of Australian Rules football over rugby league, rugby union or soccer. In this instance, a cluster sampling technique would be inherently biased.
2. Explicitly link biased sampling techniques with the investigation into the Olympics
Refer students back to the questions posed earlier in the stage:
- Who might agree that the Olympics are still relevant? Why might they feel this way?
- Who might argue that the Olympics are no longer relevant and worthwhile? Why might they feel this way?
Ask students to consider individuals or interest groups who may use a biased sampling technique to make inferences about the population that support their views about the Olympics. Examples include:
- Sporting organisations, which may choose a sample that is more likely to agree that the Olympics are still relevant and worthwhile, as this information could be used to infer that the Australian population enjoys sport, and consequentially, sporting organisations require more government funding.
- Charitable groups, which may choose a sample that is more likely to disagree that the Olympics are still relevant and worthwhile, as this information could be used to infer that the Australian population believes the money spent on the Olympic Games could be better spent supporting our most needy and the charities who support them.
As a contrast, ask students to consider individuals or groups who may want to use an unbiased sampling technique in order to make a more accurate inference about the population. For example:
- Television advertising agencies may choose an unbiased sample, as this information could be used to make inferences about how many Australians will watch the Olympics and inform decisions about the type of advertising that should be shown during the Olympics telecast.
3. Introduce an investigative task for students to complete, using a variety of sampling techniques, both biased and unbiased
Return to the question posed at the beginning of this stage:
Are the Olympic Games still relevant and worthwhile to Australians?
Discuss the practicalities and challenges of selecting a sample (either biased or unbiased) from the entire Australian population with students. The challenges include access to Australians from a variety of locations, age groups and cultural backgrounds.
Explain that students are going to complete an investigation focussed on this question, but for the purposes of their investigation, the population to select their sample from will be the students from their school. Acknowledge that there is an inherent bias present in this method and use this opportunity to emphasise the practicalities and implications of sampling.
One way of acknowledging the limitations of the approach being taken is to change the focus of the investigative question to:
Are the Olympic Games still relevant and worthwhile to students from our school?
Explain to students that as part of their investigation, different students (or groups of students) will be using different sampling techniques, both biased and unbiased, so that the implications of these techniques can be discussed.
The following graphic outlines the process that the investigation will follow:
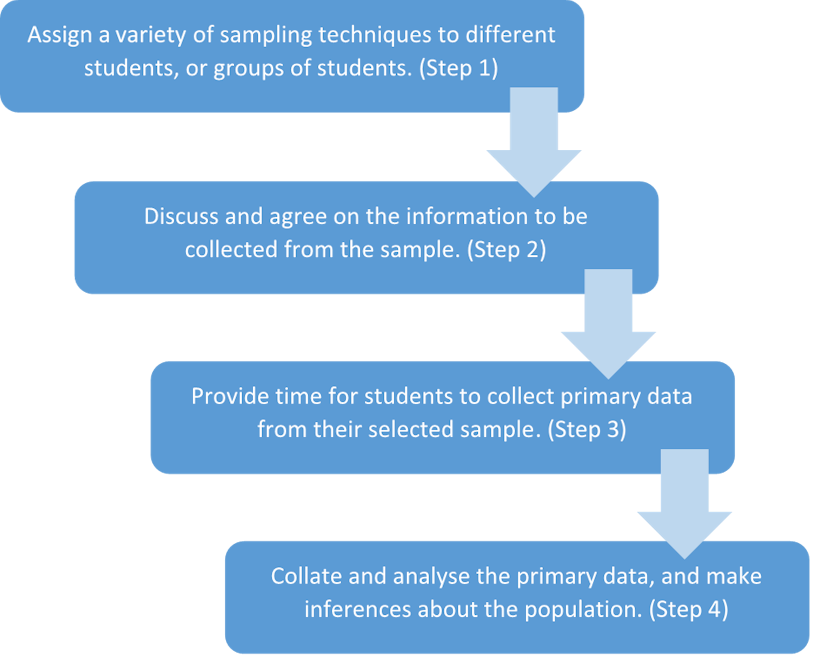
Step 1. Assign a variety of sampling techniques to different students, or groups of students
Discuss ways in which a biased sample could be collected from the students at your school. Examples include:
- Only sampling students who do, or do not, have a strong interest in sport. This could be achieved by students asking a ‘screening question’ of their sampled students, such as “Are you interested in sport?” or “Do you participate in organised sport?”. If the intention is to collect a sample of students with a strong interest in sport, then only those sampled students who respond positively to the screening question will be sampled.
- Only sampling students who do, or do not, participate in other activities. A screening question could also be used in this context.
- Only sampling students from one year level, or of one gender.
Discuss ways in which an unbiased sample could be collected from the students at your school. Examples include:
- Selecting a simple random sample from the entire population.
- Selecting a stratified random sample, where students are stratified by a certain characteristic (e.g., gender, year level).
Agree with your students on the different sampling techniques to be used and assign different sampling techniques to different groups of students. It is suggested that for each different sampling technique, you assign at least two groups. This is to allow comparison of results using similar techniques.
Step 2. Discuss and agree on the information to be collected from the sample
Explain that while different groups of students are using different sampling techniques to select their sample, it is important that all groups use the same questions to ask their sample. This allows results collected from different samples to be compared.
Facilitate a discussion regarding the specific questions that students will ask their sampled students. Remind students that the purpose of the questions is to help us make inferences about the relevance of the Olympic Games to your school population, and so they need to be designed with this purpose in mind. Explain that at least some of the questions need to be designed such that quantitative data can be collected. Suggested questions include:
- Rate your interest in the Olympics on a scale of 1 – 5, where 1 is ‘not at all interested’ and 5 is ‘extremely interested’.
- Estimate the number of hours per day during an Olympic Games that you will spend either watching or reading about the Olympics.
- How would you compare your interest in the upcoming Olympic Games with previous Olympic Games (or with other sports, or with other cultural activities)?
- Would you support the idea of your closest city launching a bid for the Olympic Games? Why or why not?
Agree on a set of questions that all groups of students will ask their sampled students.
Step 3. Provide time for students to collect primary data from their selected sample
Explain to students that they will now collect data from their sample group of students, using the agreed questions, and by using the sampling technique that they have been assigned. They will then use this data to make inferences about the population. Students should select and justify the representative sample size they will use.
Provide students time to collect primary data from their selected sample.
Different sampling techniques may require different methods of data collection. For example, students who are using a screening question may prefer to sample students face-to-face, while those collecting a simple random sample from the whole population may prefer to use a digital tool such as Google Forms or Microsoft Forms. Consider your local context when determining the best ways in which students can collect this data.
Step 4. Collate and analyse the primary data, and make inferences about the population
Guide each group to analyse the data they have collected, using a variety of measures, including:
- statistical measures: mean, mode and median
- graphical displays: frequency tables, column graphs, bar charts, histograms
Ask each group to make inferences about the population, based on the data collected. An example of an inference may be: ‘70% of students at our school have little interest in the Olympic Games’.
The focus of this section is to emphasise that different samples from the same population can provide different results (different means and medians, for example) and therefore lead to different inferences being made about the population.
Invite groups of students to share the inferences that they have made about the population.
Compare inferences made using biased sampling techniques with those made using unbiased sampling techniques. Additionally, compare inferences made using the same sampling technique (e.g. compare the data collected by two different groups of students who both used simple random sampling).
Hopefully, given the variation of the population data, and the varied sampling techniques used, the samples collected by students yield very different inferences.
Use the difference in results to provoke a class discussion. Sample prompts could include:
- What do the different inferences tell us about the sampling techniques chosen?
- Are any of these inferences more ‘trustworthy’ or ‘reliable’ than others?
- Can any of these inferences give us a definitive answer to the question we were investigated?
- Of the inferences presented, which do you think certain interest groups would use, and why?
- Why could groups using the same sampling technique make different inferences?
- What do our results tell you about sampling in general?

Extend students by introducing the concept of sampling error to students. The first 1:15 of this video can support your explanation.
Elon University Poll, 2014. What is sampling error?. [Online]
Available at: https://www.youtube.com/watch?v=uGuWrPFStdg
[Accessed 15 March 2022].
Holmes, T., 2019. Is the Olympic Games still relevant to Australians?, ABC News, 17 November. [Online]
Available at: https://www.abc.net.au/news/2019-11-17/is-the-olympic-games-still-relevant-to-the-abcs-radio-audience/11704654
[Accessed 15 March 2022].
Kidd, B., 2018. Do the Olympics still matter?, The Conversation, February 5. [Online]
Available at: https://theconversation.com/do-the-olympics-still-matter-90215
[Accessed 15 March 2022].
Pittis, D., 2016. Now it can be said – the Olympics are a waste of time and money, CBC, 22 August. [Online]
Available at: https://www.cbc.ca/news/business/olympics-economics-curmudgeon-pittis-1.3726383
[Accessed 15 March 2022].
Pritchard, D., 2016. Our Olympic team is a terrible waste of money, Sydney Morning Herald, August 3. [Online]
Available at: https://www.smh.com.au/opinion/our-olympic-team-is-a-terrible-waste-of-money-20160803-gqjx18.html
[Accessed 15 March 2022].
Other stages
1. An Introduction to Sampling
EXPLORESuggested Learning Intentions
- To understand that sampling is necessary to make inferences about a population
- To be able to explain and use at least two different sampling techniques
Sample Success Criteria
- I can explain how a sample could be used to make inferences about a population
- I can use a recognised sampling technique to select a sample
- I can model and justify my thinking using a range of manipulatives
2. Podiums and the Pool
EXPLORESuggested Learning Intentions
- To use different tools to represent information, to solve a problem or support an opinion
- To understand the concepts of ‘and’ and ‘or’ when used in the context of probability
Sample Success Criteria
- I can construct a two-way table and a Venn diagram to represent information
- I can use these graphical displays to help solve problems
- I can use a range of manipulatives to model and justify my solutions
- I can explain the meaning of 'and' and 'or' as used in probability
4. Does Hosting Help?
EXPLORESuggested Learning Intentions
- To synthesise and analyse data from a variety of sources to make inferences
- To informally identify outliers and explain their impact
Sample Success Criteria
- I can use data that includes outliers to make inferences about a population
- I can identify outliers and explain their impact on a data set
- I can explain my thinking and solutions using a range of manipulatives