
Suggested Learning Intentions
- I can design a question to investigate that can be answered using statistics
- I can collect, analyse, and interpret data to address a real-world problem
- I can describe data using statistics
Sample Success Criteria
- I can explain how populations differ using statistics and graphic techniques
- I can model data using manipulatives
- I can justify my choices of how I represent data visually or with statistics
- I can communicate my findings effectively
- If the World Were a Village: A Book About the World’s People (Smith, 2020)
- If the World Were a Village (a short introductory video linked to the book, which is available in various languages including Vietnamese, Spanish and French)
- If the World Was Only 100 People (video uses 2016 data)
- If the World Were 100 People (video uses 100 people to represent 2016 data)
- Data representation examples: Scenario 1, Scenario 2 and Scenario 3
- Sample quiz questions: docx PDF
- Welcome to the Village student task: docx PDF
- Data journals: docx PDF
- Poster paper
- Optional: materials for building models (e.g. Lego, Unifix, art and craft materials)
This stage is based around the book, If the World Were a Village (Smith, 2019).
In this book, the world has been represented as a village of 100 people. Each villager represents approximately 77 million people in the real world, but the proportions of people with particular characteristics have been kept the same. By placing the population of the village at 100 people, the author makes mathematical analysis easy.
In this stage, students will learn about global statistics and make decisions about data representation. The outcome will be a ‘gallery exhibition’ of the global data.
Begin with a class quiz to explore what students already know about global statistics. Questions might include, ‘Which continent would most people come from?’, ‘What is the most common animal found in the village?’, and ‘What percentage of people can access a university education?’
See sample quiz questions in the Materials and Texts section. The answers to these can be found in the book. You could also use digital tools to create an interactive quiz.
Read the book aloud to students or view one of the videos listed in the Materials and texts section. Discuss the quiz responses in light of this new information.
Ask students, ‘What other data would be interesting to collect?’ Examples might include how many people in the village are left-handed, or how many wear glasses.
Discuss changes to the world’s population between the 2011 and 2020 editions of this book. In 2011 the global population was 6.7 billion. By 2019 it was 7.7 billion. You may want to show students the World population clock or World Population Growth graphs to demonstrate how rapidly the population is growing.

Enable students by providing a hard copy of the text or conducting a shared reading of the text in small groups to examine the data more closely. Teach new and unfamiliar vocabulary to students prior to beginning this stage.
Extend students by inviting them to suggest questions the researchers may have posed, and to hypothesise how the data might have been collected.
Introduce the idea of a Gallery Exhibition showcasing displays based on global statistics. The purpose is to teach the school community about global statistics while showcasing what students have learned about data representation. The theme will be ‘Welcome to the Global Village’.
The students' task is to visually represent the data from 'If the World Were a Village' in creative ways and to effectively communicate their findings.
Access the ‘Welcome to the Village’ student task from the Materials and Texts section.
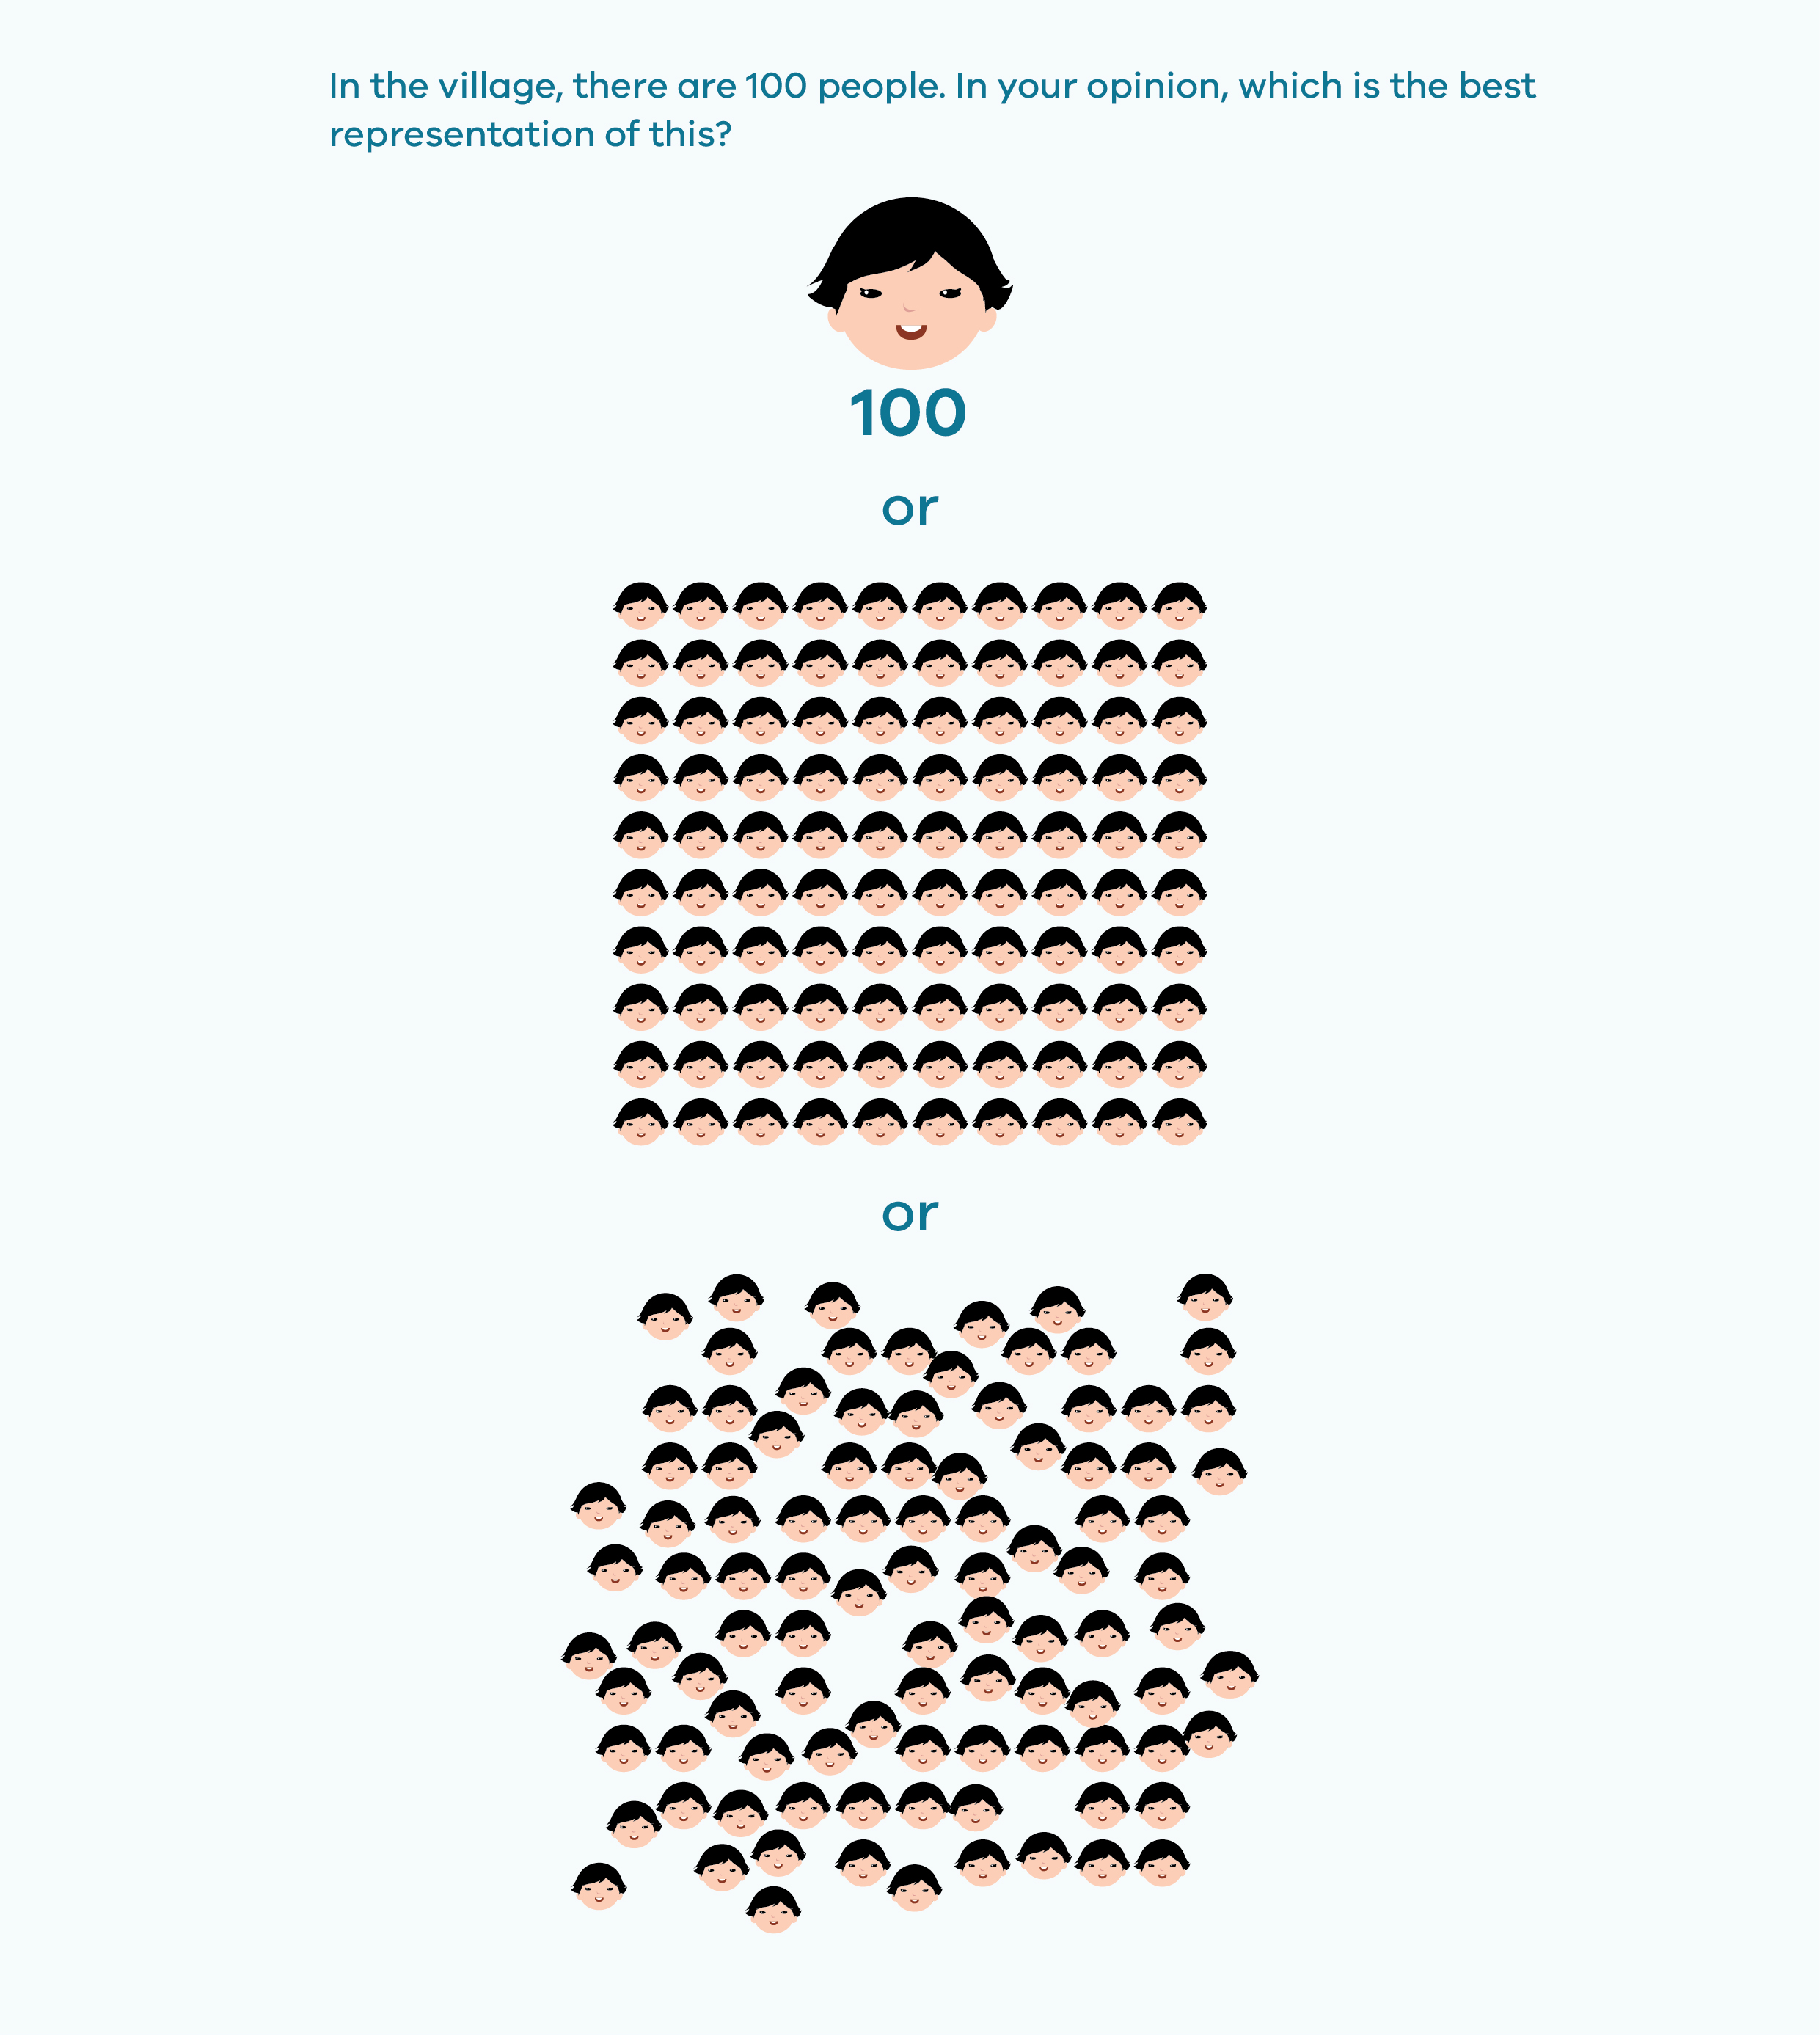
Support students to understand the purpose of the task by presenting examples of different representations of the data. Share the three different scenarios shown in the following images with students and invite them to share which they find the most effective for communicating information clearly and effectively.
Scenario 1
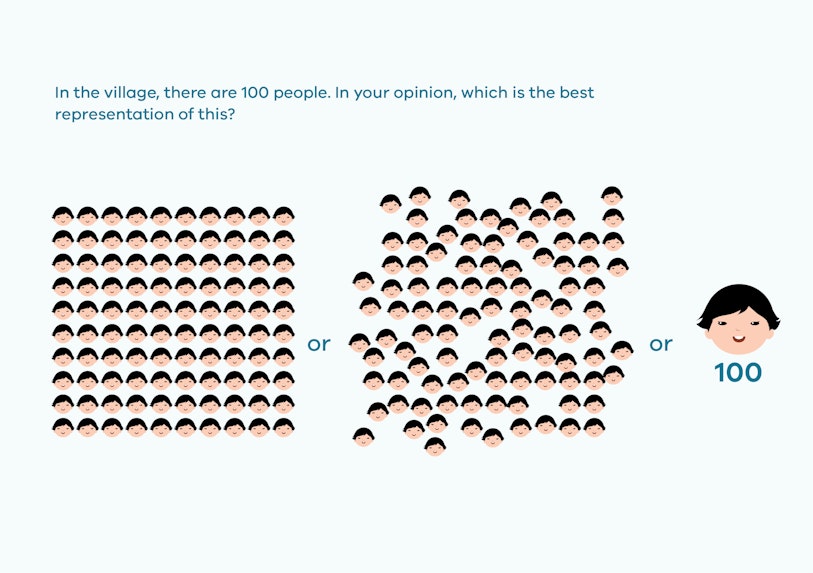
Scenario 2
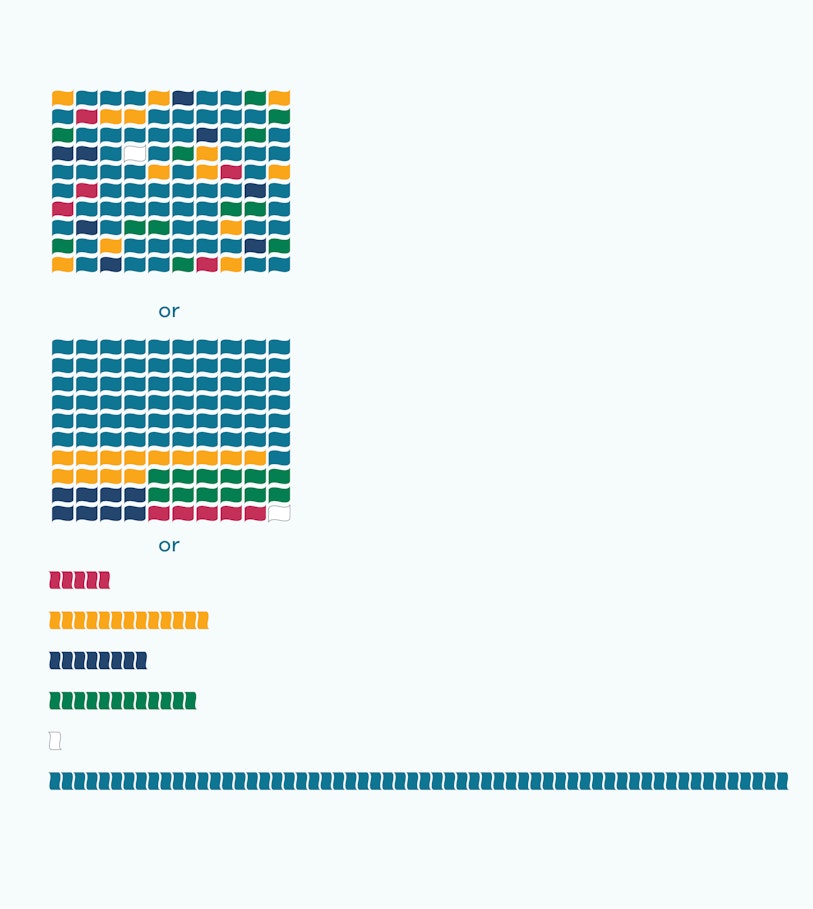
Scenario 3
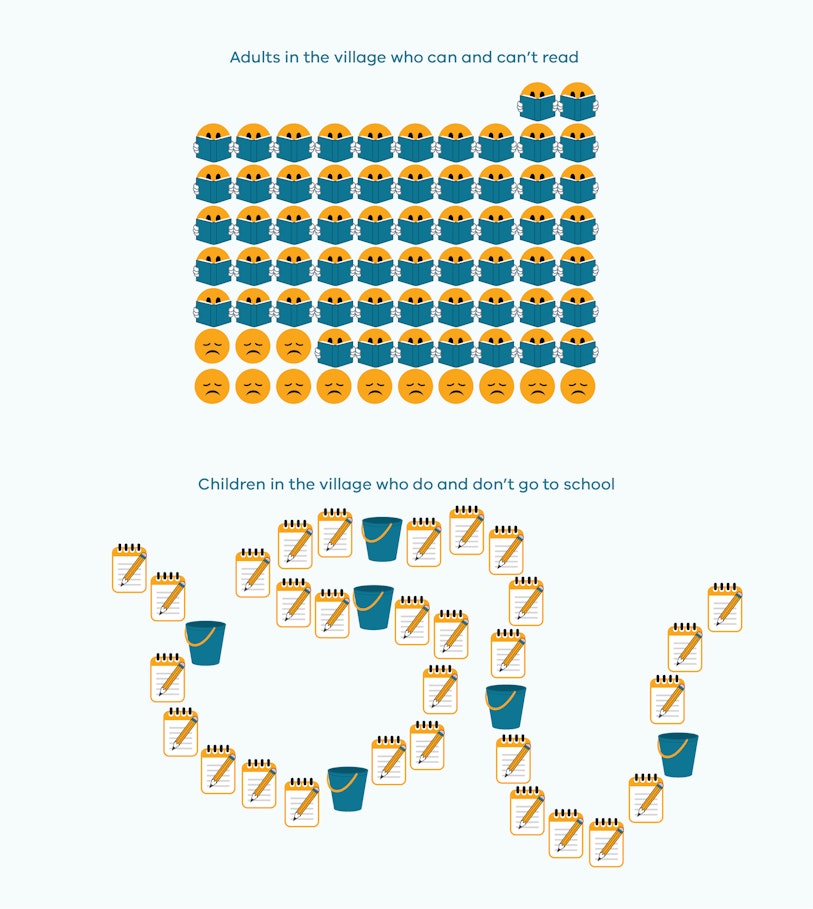
Explain the task: ‘Your challenge is to decide how to represent some of the data from the book.’
Provide some suggestions:
- 85 villagers have electricity, while 15 do not.
- 80% of the village’s energy comes from fossil fuels, 11% comes from nuclear power, and 9% comes from renewable sources such as wind and water.
- 88 people have access to a source of safe water either in their homes or within a short distance; 12 do not and must spend a large part of each day simply getting safe water. Most of the work of collecting water is done by women and girls.
- 69 people have access to adequate sanitation - they have public or household sewage disposal - while 31 do not.
- 12 villagers breathe clean air, while 88 breathe air that is unhealthy because of pollution.
The following activity has been adapted from NRICH and updated with 2019 data. Before students begin, explore some different ways of representing the data visually. Inspiration may come from If the World Were 100 People video or graphs from the Gapminder website. Some selected images from The World of 100 website may also be suitable for use with students.
Provide students with the task outline and support them to complete the task. Adapt and modify this task card to suit your class and context.
Enable students requiring further support by asking them to represent their data on a 10 x 10 array chart first.
Extend students by asking them to include statistics from the Gapminder website.
Confer with students about how to display their data representation work in the Art Gallery. Students may choose to pose questions for visitors, for example:
- How many villagers would speak English as a first language?
- What fraction of villagers would have electricity?
- What percentage of villagers would be children?
Provide each group with an opportunity to present their findings and encourage the audience to ask mathematical questions based on the data.
Areas for further exploration
1. Model the data
Choose 100 people from your school community to represent the population of the village, and physically model data sets from the book. This will promote student engagement, particularly when talking about equity issues such as who has access to wealth, electricity and computers.
2. Compare to your school
Students can collect and represent school data and make comparisons to world data. Ask students to make predictions – will there be any similarities?
3. Compare to Australia
Similar statistics have been collected from Australian census data. See If Australia were a village of 100 people and This is Australia as 100 people.
4. Explore and compare statistics from various countries
The CIA World Fact book provides demographic information for every nation in the world: population, age distributions, death and birth rates, economy, government, transportation and geographical information. Find Australian statistics here. Students may like to investigate other countries. Other websites containing statistics are listed in If the World Were a Village (Smith, 2019).
Revisit the quiz in order to consolidate student understanding. For an interesting variation, start with everyone standing. If a student asks or answers a question they can sit down. Students take turns to question each other about the data, and the game ends when everyone has participated and is sitting down.
Extend students by asking:
- What are the characteristics of the average villager?
- What might be the advantages of villagers speaking more than one language?
- Imagine our village 50 years from now. What changes would you like to see in the data?

You may want to co-construct an assessment rubric with your students. Students could use the rubric to monitor their own progress and for self/peer assessment.
Assessment of student learning at this stage of the sequence could include:
- using the Connect, Extend, Challenge thinking routine for peer-assessment.
- using Data Journals to sketch visual representations and explain why these were chosen.
- Reflecting on what was learned.
9 Story Media Group, 2013. If the World Were a Village - Promo. [Online]
Available at: https://www.youtube.com/watch?v=XUHA2-YRtKA
[Accessed 15 March 2022].
ABC News, 2017. Census 2016: This is Australia as 100 people. [Online]
Available at: https://www.abc.net.au/news/2017-06-27/census-australia-as-100-people/8634318?nw=0 28 June, 2017
[Accessed 15 March 2022].
Central Intelligence Agency (CIA), 2020. World Factbook: Australia. [Online]
Available at: https://www.cia.gov/the-world-factbook/countries/australia/
[Accessed 15 March 2022].
Gapminder, 2020. Play with the Data. [Online]
Available at: https://www.gapminder.org/tools/#$chart-type=bubbles
[Accessed 15 March 2022].
Global Change Data Lab, 2020. Our World in Data: World Population Growth. [Online]
Available at: https://ourworldindata.org/world-population-growth
[Accessed 15 March 2022].
Good Magazine, 2016. Good Data: If the World were 100 People. [Online]
Available at: https://www.youtube.com/watch?v=QFrqTFRy-LU 14
[Accessed 15 March 2022].
Harvard Graduate School of Education, 2019. Project Zero: Connect, Extend, Challenge. [Online]
Available at: https://pz.harvard.edu/sites/default/files/Connect%20Extend%20Challenge_0.pdf
[Accessed 15 March 2022].
Kahoot, 2013. Kahoot. [Online]
Available at: www.kahoot.com/
[Accessed 11 May 2020].
Plickers Inc, 2019. Plickers. [Online]
Available at: https://get.plickers.com/ 2019
[Accessed 15 March 2022].
Smith, D. J., 2020. If the World Were a Village: A Book about the World's People. 2 ed. Toronto: Kids Can Press Ltd..
Toby Ng Design, 2020. The World of 100. [Online]
Available at: https://www.toby-ng.com/works/the-world-of-100/
[Accessed 15 March 2022].
University of Cambridge, n.d. NRICH: If the World Were a Village. [Online]
Available at: https://nrich.maths.org/7725
[Accessed 15 March 2022].
Walle, V. d., Bay-Williams, J., Lovin, L. & Karp, K., 2018. Teaching Student-Centered Mathematics. Developmentally appropriate instruction for grades 6-8. 3 ed. New York: Pearson Education.
Worldometer, 2020. World Population Clock. [Online]
Available at: https://www.worldometers.info/world-population/
[Accessed 15 March 2022].
Other stages
1. Class Statistics
EXPLORESuggested Learning Intentions
- To gather and organise data to answer questions about our world
- To explore various graphic techniques and explain how they provide a different picture of the shape of the data
Sample Success Criteria
- I can gather and organise my data to answer questions about the sample population the data came from
- I can demonstrate my solution and thinking using a variety of manipulatives
- I can describe key features of graphs
- I can construct graphs in ways that help me represent and understand data
2. Talking Rubbish
EXPLORESuggested Learning Intentions
- To design questions that can be answered using statistics
- To investigate how data can be used to solve real world problems
- To describe data using numbers; these are called statistics
Sample Success Criteria
- I can design a question to investigate that can be answered using statistics
- I can collect, analyse, and interpret data to address a real-world problem
- I can model data using a variety of manipulatives
- I can describe data using statistics
3. Demographic Diversity
EXPLORESuggested Learning Intentions
- I can design a question to investigate that can be answered using statistics
- I can collect, analyse, and interpret data to address a real-world problem
- I can describe data using statistics
Sample Success Criteria
- I can design a question to investigate that can be answered using statistics
- I can collect, analyse, and interpret data to address a real-world problem
- I can describe data using statistics
- I can model data using a variety of manipulatives and use this to analyse the data