
Suggested Learning Intentions
- To predict the likelihood of an outcome
- To understand that some games involve random processes and that previous results have no impact upon future outcomes
- To explain the difference between dependent and independent variables
Sample Success Criteria
- I can assign probabilities to particular events
- I can use manipulatives to model events and justify my solutions
- I can use a Venn diagram to calculate probability
In this activity, students will learn how to present data using a Venn diagram. It can be used to organise information and calculate probabilities. A Venn diagram describes relationships between events. The rectangle of a Venn diagram represents the sample space (the total number sampled). Each circle within the rectangle represents an event (a subset of the sample space).
For this activity, the teacher should work with students to decide which two choices/options are relevant and appropriate for the class. These choices must be carefully thought through in the context of the class and students’ individual circumstances. The choices can be a preference for cats vs dogs, chocolate vs vanilla flavour, being a night owl vs an early riser or other options that would allow all students to feel included and not judged.
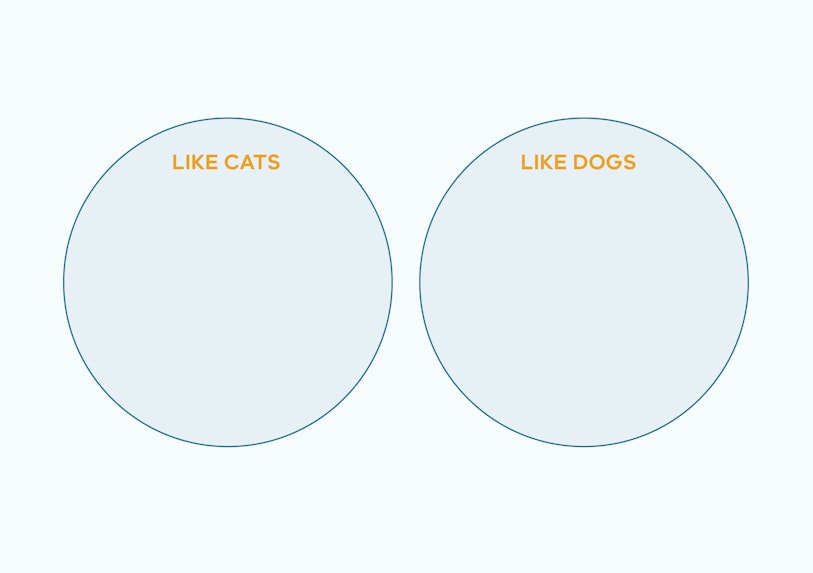
Give each student a small slip of paper or sticky note and ask them to choose one of the options, for example preferring cats or dogs. Draw two large circles on the board. Label one circle Cats and one circle Dogs. Tell each student that they must bring their piece of paper to the board and place it in the appropriate circle. Students select one of the two categories.
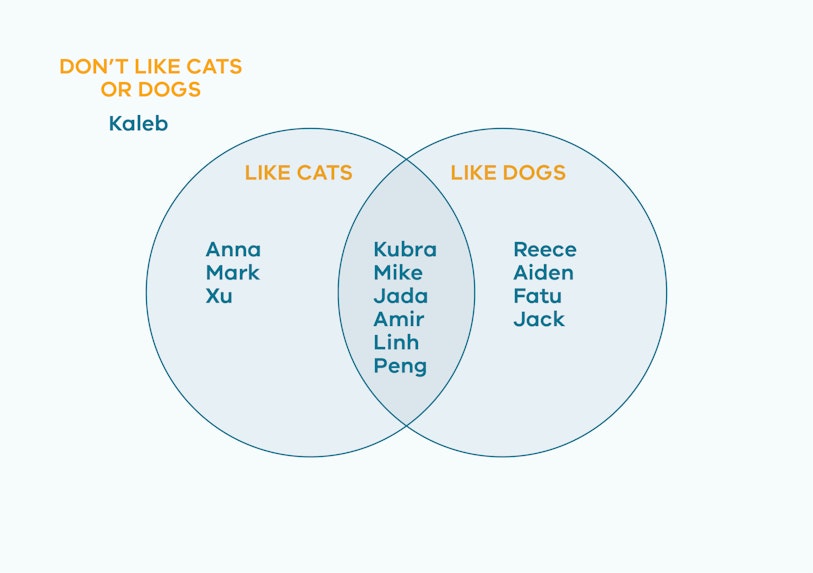
Discuss with the class what to do when a student does not fit one for these categories. For example, a student might like both cats and dogs, or might not like either. Review and reconstruct the Venn diagram so that it meets the conditions for all students. Eventually you will have a Venn diagram that looks like this:
It is important that the creation of the Venn diagram comes at the suggestion of the students. It is a much more powerful learning tool and students are more likely to remember that the original tool did not fit their context and that the class worked together to come up with a more representative diagram, that the two circles intersect for students who like both cats and dogs.)
Once constructed, have students describe the relationship depicted by the Venn diagram. Using the example above, lead students to describe the information contained within the Venn diagram: from a total of 14 students, three students prefer cats, four students prefer dogs, one student doesn’t like any and six students love both cats and dogs.
Enable students by providing concrete materials such as hoops to allow them to model the different relationships. A Venn diagram template is available to download from the Materials and texts section above.
Venn diagrams usually contain total numbers. However, the activity above uses student names to help students to see that those in the intersecting circles are not the same pieces of data as those in each circle.
Next, have students transition into describing each relationship using fractions.
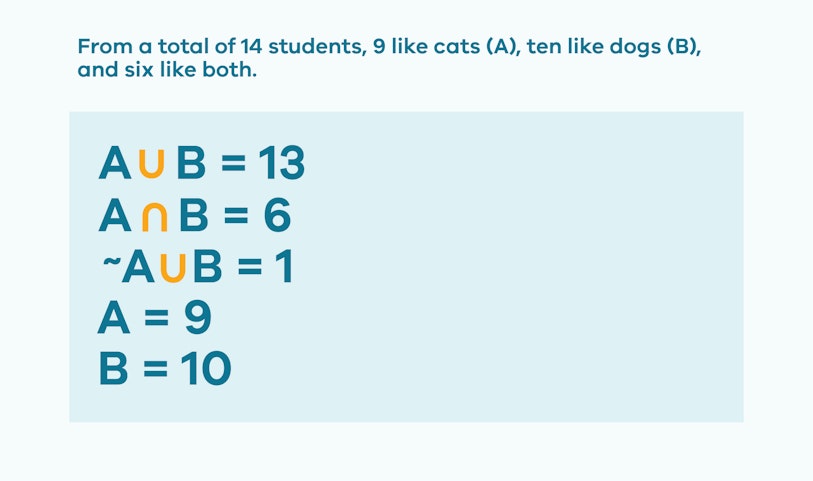
⁹/₁₄ students like cats, ¹⁰/₁₄ students like dogs, ¹/₁₄ student like neither dogs nor cats and ⁶/₁₄ students like dogs and cats.
Students use the fractional information to describe the probability of a student in the classroom liking either cats, dogs, both or neither.
The probability that a randomly selected student likes neither cats nor dogs is: Pr = ¹/₁₄ = 0.07
Extend students by having them describe the relationship depicted in the Venn diagram using the following notation.
Further explore this activity by asking students to compare their class results with another class in the school.
Enable students by converting your class data to a fraction out of 100 to make it easier for them to compare classes.
Present the following scenario to students:
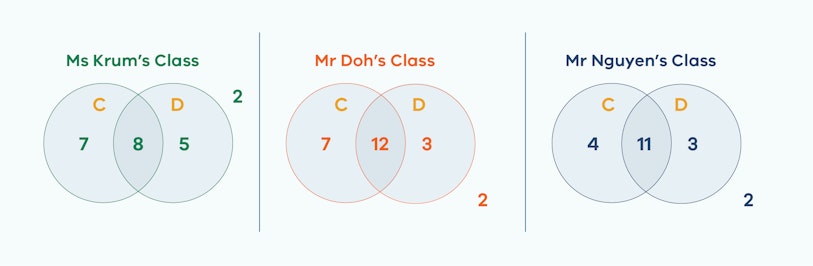
Another two classes in this school have also created a Venn diagram about the animal preferences of each student. I want you to compare our class diagram and their class diagrams and show me which class has the greater chance of a student not liking both cats and dogs.
You may decide to use real data from another class or pre-prepared data as provided below.
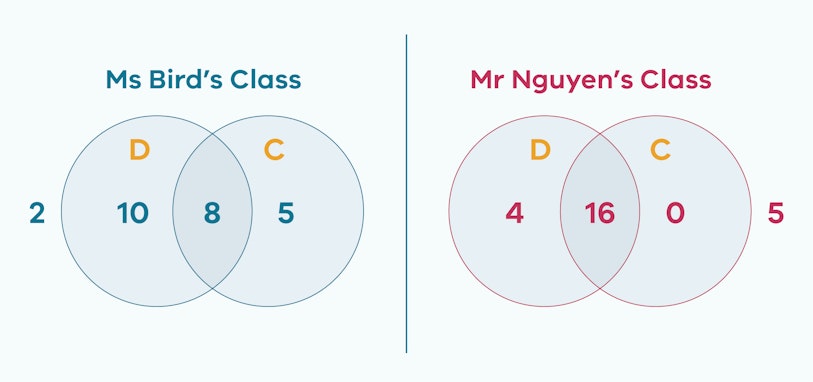
The examples provided have class sizes of 25 students. This simplifies the conversion to a fraction of 100.

Converting a fraction out of 25 into a percentage – Example conversation with students:
You will need a 1 m ruler for this demonstration.
Teacher: What is ⁶/₂₅ as a percentage?
Student answers will vary.
Teacher, indicating with their hands to the 1 m ruler: This ruler represents 100%, or the whole class. Where would ⁶/₂₅ be on this ruler?
Student: Points to the 25 or the 6 on the ruler.
Teacher: Not quite right, do you know where one fourth is on this ruler?
Student: Points to the 25 again.
Teacher: Correct! That is one fourth. Do you know what that is as a percentage?
Student: 25%
Teacher: Do you know where one eighth is?
At this point if a student cannot identify one eighth, they are not ready to convert ⁶/₂₅ into a percentage, and you should adjust the task so that they are recording the chance as a fraction or take the opportunity to have the student develop understanding of unit fractions by folding a rectangular piece of paper.
Student: Points to the 12.5 cm mark.
Teacher: So, what is one eighth as a percentage?
Student: Is it 12.5%?
Teacher: Great! How would we find out where ¹/₂₅ is? What would we have to do?
If students understand unit fractions, then the questioning will proceed as follows. If not, we loop back to folding fractions and then division of the 100 by 25 on a calculator if needed.
Student: Divide it into 25 pieces?
Teacher: Great, can you do that in your head?
(If not, offer a calculator otherwise the cognitive load of solving the division problem will block the student’s ability to learn the conversion concept.)
Teacher: So, if ¹/₂₅ is worth 4 cm, what is that as a percentage?
Student: Is it 4%?
Teacher: That’s right, so what would ⁶/₂₅ be as a percentage?
Student: 24%.
Teacher: Correct! So, what do we need to do if we want to turn twenty-fifths into percentages?
Student: First you need to know that ¹/₂₅ is worth 4%, then you multiply by the number of twenty fifths that you have.
Extend students by providing the following class examples which do not have 25 students.
This activity involves students predicting which of four coloured balls will be randomly selected from a box. Students record their predictions and outcomes in a table like the one below. After each selection, the coloured ball is returned to the box.
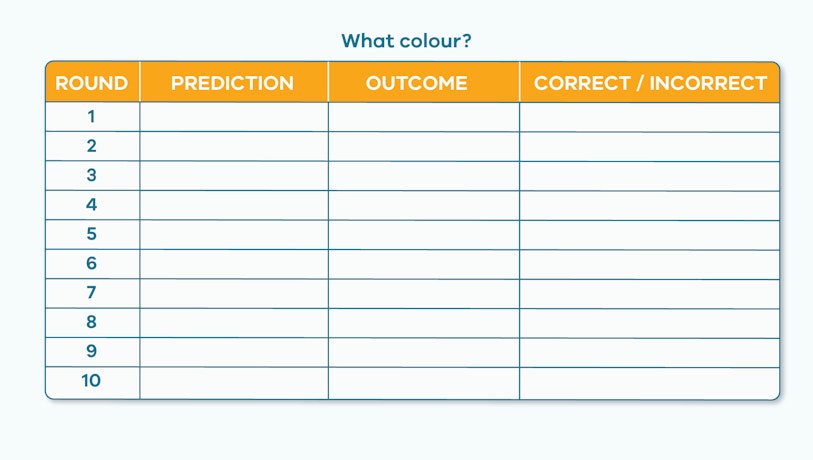
- The game runs for a total of 10 rounds. At the beginning of each round, students predict which ball they believe will be randomly selected from the box. Ensure they record this in their table.
- Once a ball is selected, students either predict correctly (tick) or incorrectly (cross) and record the colour of the ball drawn.
- After 10 rounds, students calculate the total number of times they predicted correctly.
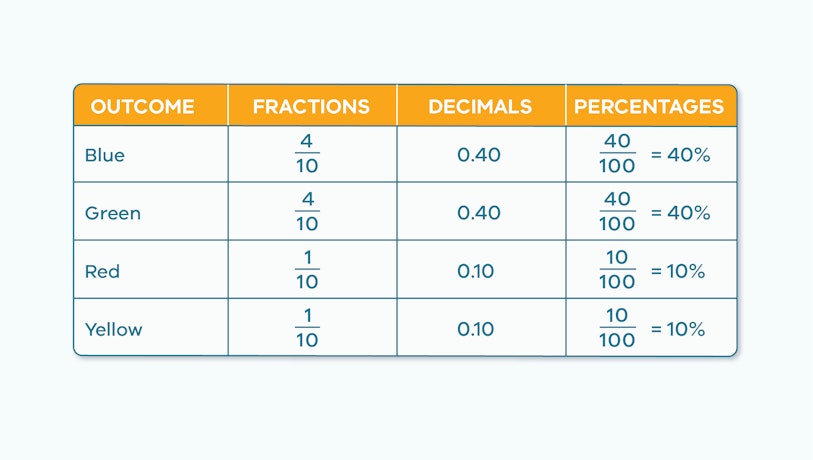
- Students then represent their experimental data in a Fractions-Decimals-Percentages table.

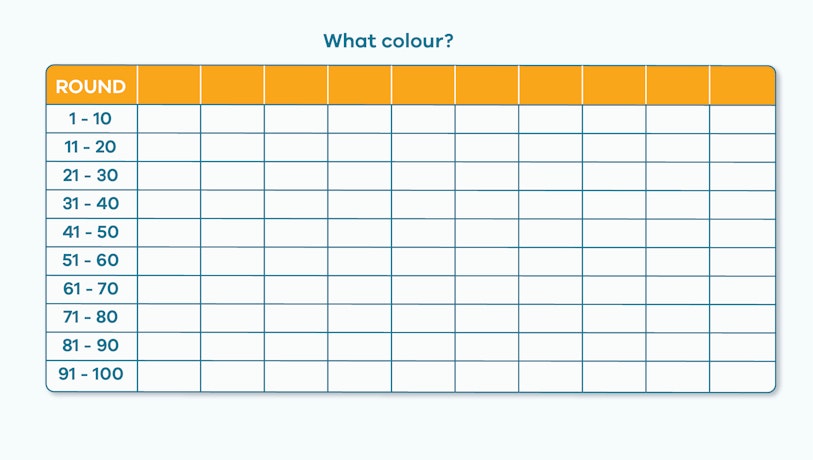
While the activity explained here is conducted by the classroom teacher and runs over ten rounds, you may decide to conduct more trials and/or have students play the game in smaller groups so that your class has more sets of data to compare. Below is an example of a 100-trial table.
Have students compare their experimental results with that of the theoretical probability. Ensure at the conclusion of the activity that all students can identify that each colour each round has a ¹/₄ chance of being selected.
Questions to ask either during the activity or at the end of the activity (for example):
- If a colour comes up three times in a row, what is the likelihood of it coming up a fourth time?
- Are you better off selecting one colour for the whole game or choosing a different colour for each round?
Enable students by asking them to turn their table into a column chart by shading the columns.
Enable students by asking them to answer the following sentence starter:
Out of the ___________ rounds red came up ___________ times. How does this compare with what you expected?
The coloured ball activity supports students to understand that chance has no memory. Each time a ball is selected it is independent of the previous selection. A common misconception is that if a ball is selected several times, then it is less likely to be selected the following time. Students will often say ‘there is no way that red will get picked again’.
In this activity, students are encouraged to work with manipulatives to support them to build intuition around probability. Moving too quickly to procedural aspects of probability doesn’t allow students to experience randomness. For example, when tossing a coin, whilst it is unlikely that the coin will land on heads 10 times in a row, it is possible. Each toss of the coin is an independent event. This activity allows students time to experience this randomness.
Areas for further exploration
1. The Probability of Gambling
A recent study conducted by Freund, M et.al 2019, identified that one-third of Victorian students between the ages of 12 and 17 had gambled. The study also found that 73% of students had been exposed to gambling ads in the previous month. Therefore, it is important that schools play a role in educating students about the risks associated with gambling.
The following resource is a 5-lesson gambling program which can be used to support students to develop informed attitudes towards gambling and reduce harm from gambling in the community. The resource was created by the Mathematical Association of Victoria for the Victorian Responsible Gambling Foundation. It was first published in 2016 then republished in 2018. Access the resource here.
This resource supports teachers to help students avoid gambling-related harm while developing numeracy skills. The following table details the five lessons within the resource.
| Lesson 1. | Chance has no memory |
| Lesson 2. | Who are the real winners? |
| Lesson 3. | Poker machines |
| Lesson 4. | Sports betting |
| Lesson 5. | Horseracing |
Several spreadsheet simulation activities are provided throughout the resource. Students can use these to visualise large-scale simulations. The spreadsheets can be accessed here.
2. Everyday Probability
For those schools who wish to not include gambling resources in their programs, the following alternative Area for Further Exploration activity is presented.
View this ABC Catalyst episode, which features several everyday scenarios where probability can be applied to make better decisions. The first story (around the 5-minute mark) is based on a group of young Sydneysiders trying to choose the beach with the best surf. Rather than spend all day driving around, they discuss how to use probability to increase their chances of finding the best beach.
This stage supports students to represent chance using fractions, decimals, and percentages and to compare experimental and theoretical probability. Have students draw a probability scale. Ask students if 0 is the start of the probability scale and it represents impossible and 1 represents certain, where would the theoretical and experimental results sit within this scale?

Have students reflect on their learning in pairs. Each student justifies their reflection to one another before sharing their reflections with you. The following prompts may help you to guide the students to clarify their thinking.
- Can we consider anyone a winner from this activity?
- What would it mean to win in this activity? Is it the person who correctly predicts the most coloured balls or is there a winner for each round?
- If someone did win, did they have a trick to help them win or did they get lucky?
- Luck is something that happens by chance, as opposed to the likelihood of something happening. If students believe they had a trick – investigate what that trick is.
- Did everyone have the same chance of winning? Why or why not?
ABC: Catalyst, 2018. The Secret To Making Better Decisions. [Online]
Available at: https://www.abc.net.au/catalyst/the-secret-to-making-better-decisions/11017274
[Accessed 15 March 2022].
Freund, M. et al., 2019. The prevalence and correlates of gambling in secondary school students in Victoria, Australia, 2017. [Online]
Available at: https://responsiblegambling.vic.gov.au/documents/680/Freund-Gambling-in-secondary-school-students-in-Victoria-2017-Oct-2019_Qu9AD8V.pdf
[Accessed 15 March 2022].
Sullivan, P., 2017. Challenging Mathematical Tasks. South Melbourne: Oxford University Press.
Victorian Responsible Gambling Foundation, 2018. VCAL – Numeracy unit: What are the odds?. [Online]
Available at: https://responsiblegambling.vic.gov.au/documents/600/VRGF_MAV_Numeracy_2019_web.pdf
[Accessed 15 March 2022].
Victorian Responsible Gambling Foundation, 2021. Resources for teachers. [Online]
Available at: https://responsiblegambling.vic.gov.au/reducing-harm/schools/resources-teachers/
[Accessed 15 March 2022].
Other stages
1. What Does our Village Look Like?
EXPLORESuggested Learning Intentions
- To understand the difference between a population and a sample
- To design and conduct a survey
- To gather and evaluate categorical and numerical data and represent it using fractions, decimals, and percentages
Sample Success Criteria
- I can explain the difference between a population and a sample
- I can collect information based on questions that I pose
- I can explain the difference between numerical and categorical data
- I can use manipulatives to model the data and explain my thinking
- I can use fractions, decimals, and percentages to represent survey results
2. And the Average is...
EXPLORESuggested Learning Intentions
- To describe, interpret and compare data using mode, median, mean and range
- To explain the difference between a population and a sample
Sample Success Criteria
- I can describe data using words such as mode, median, mean and range
- I can explain the difference between a population and a sample
- I can use a range of manipulatives to model and explain my thinking
4. Take a Chance
EXPLORESuggested Learning Intentions
- To understand that a ‘game of chance’ involves chance rather than skill to determine the outcome
- To list the outcomes of chance experiments
- To define and compare experimental and theoretical probability
Sample Success Criteria
- I understand that a ‘game of chance’ involves chance rather than skills to determine an outcome
- I can list the outcomes of chance experiments
- I can compare theoretical probability and experimental probability
- I can record frequencies in a tally chart and calculate the relative frequency